Tools4MSP Geoplatform - legacy/deprecated version
Feb. 10, 2023, 11:25 a.m.
Tutorial: Tools4MSP introduction
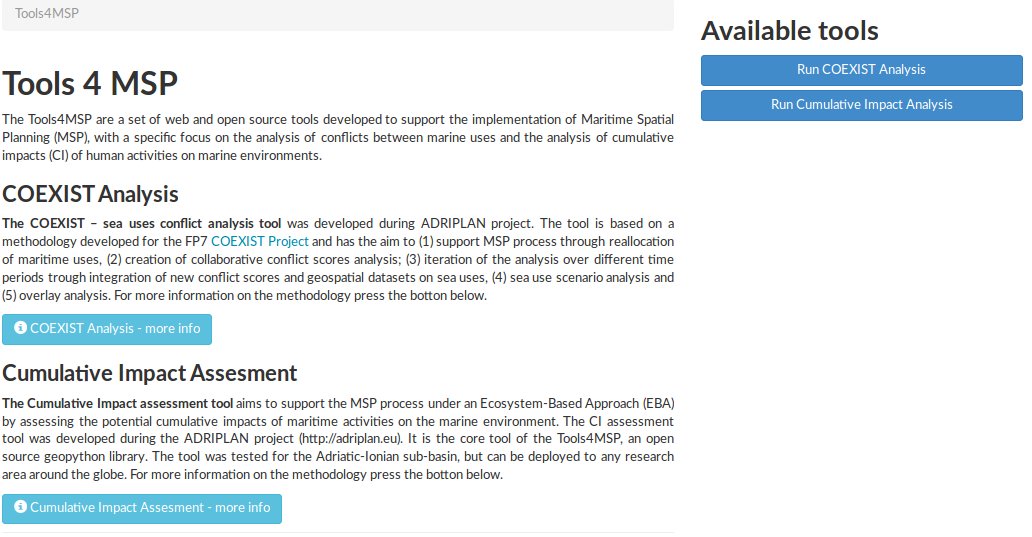
The Tools4MSP main page presents you the available tools (on the right side) and some general information on their goals and functionalities (on the main left side).

Figure 1: Tools4MSP main page
You can have more detailed information on each tool clicking on the light blue buttons with the  symbol or run the tools by clicking the blue buttons on the right.
Be aware that, in order to use the tools, you have to be registered user.
If you're not a registered user, when clicking the tools button you'll be redirected to the registration form. Please look at this tutorial to learn how to become a registered user in the ADRIPLAN Data Portal.
Step 1: Case study selection
Select one of the available case studies listed to move to the Step 2: Case study setup page.
Figure 2: Step 1 Case study selection
Step 2: Case study setup page

Figure 3: Step 2: Case study setup page
Here you can configure your case study (both input data and geographical extent) following the instructions on the page, then you can run the analysis clicking on the blue "Run Analysis" button on the right.
After waiting a few seconds (the processing time depends on the number of layers included and the geographical extent), the tool processes the data and you'll be presented the Step 3: Results page.

Figure 4: Step 3: Results
Here you can explore: * the processed output as a data layer on a map; * some details on the input dataset and total Cumulative Impact Score (left panel); * various graphical statistics of the case study results (scrolling down the web page).
The output layer is also automatically saved and published in the ADRIPLAN Data Portal and you can view it clicking on the View layer button, or dierctly improving its metadata clicking on the Complete metadata button.